Sixth generation console sales
The sixth-generation era includes Sega Dreamcast, Playstation 2, Xbox, and Nintendo GameCube. Game Boy Advance was the lone successful handheld. This era began on November 27, 1998 and ended in 2013 as the Playstation 2 was discontinued
Sixth generation hardware sales[]
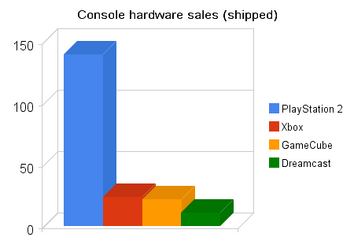
The sixth generation of video games sold a record-breaking 180+ million consoles[1] and 85 million handheld systems.
| System | Worldwide | Americas | Japan | Elsewhere | |
|---|---|---|---|---|---|
| Console | |||||
| PlayStation 2 | 127 million (as of December 31, 2007)[2] | North America: 50 million (as of November 2008)[3] | 21,418,700 (as of January 2009)[4] | Europe: 48 million (as of May 2008)[5] | |
| Xbox | 24 million (as of May 10, 2006)[6] | North America: 14.6 million [7] | 472,552 (as of 2006)[8] | Europe: 5.5 million [7] | |
| GameCube | 21.74 million (as of March 31, 2008 )[9] | 12.94 million (as of March 2008)[9] | 4.04 million (as of March 2008)[9] | 4.77 million (March 2008)[9] | |
| Dreamcast | 10.6 million (as of September 6, 2005)[10][11] | US: 5,433,501 (as of March 2001)[12] | 2.32 million (as of March 2001)[13] | Europe: 1.97 million (as of March 2001)[13] | |
| Handheld | |||||
| Game Boy Advance | 81.06 million (43M for SP, 2M for Micro) | 41.64 million [9] | 16.88 million [9] | 22.53 million [9] | |
| N-Gage | 3 million | ||||
North America[]
| Year | Sales | |||
|---|---|---|---|---|
| Dreamcast (US)[13] | PlayStation 2 [14] | GameCube [15] | Xbox [7] | |
| 1999 | 2,500,000 | N/A | N/A | N/A |
| 2000 | 4,280,000 (+1,780,000) |
1,460,000 | N/A | N/A |
| 2001 | 5,432,816 (+1,152,816)[16] |
9,870,000 (+8,410,000) |
2,220,000 | 1,500,000 |
| 2002 | 5,433,501 (+685)[16] |
21,200,000 (+11,330,000) |
5,130,000 (+2,910,000) |
5,400,000 (+3,900,000) |
| 2003 | N/A | 29,090,000 (+7,890,000) |
7,850,000 (+2,720,000) |
8,600,000 (+3,200,000) |
| 2004 | N/A | 32,860,000 (+3,770,000) |
10,460,000 (+2,610,000) |
13,200,000 (+4,600,000) |
| 2005 | N/A | 40,990,000 (+8,130,000) |
12,180,000 (+1,720,000) |
14,600,000 (+1,400,000) |
| 2006 | N/A | 46,530,000 (+5,540,000) |
12,810,000 (+630,000) |
N/A |
See also[]
Charts[]
6th generation NPD first 5 months [1]
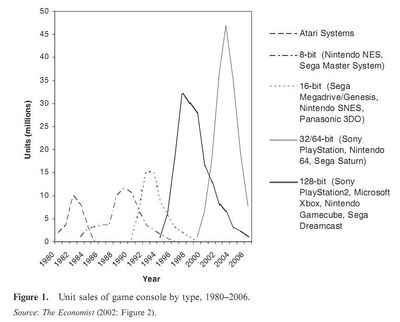
Economist graph from 2002. (post 2002 are forecasts)
References[]
- ↑ http://www.dfcint.com/wp/?p=209
- ↑ http://www.gamesindustry.biz/articles/hirai-targets-150-million-ps3-sales
- ↑ http://www.msnbc.msn.com/id/28642933/
- ↑ http://www.neogaf.com/forum/showthread.php?t=348979
- ↑ http://www.eurogamer.net/articles/ps3-has-outsold-xbox-360-in-europe
- ↑ Xbox.com | News - 20060510
- ↑ 7.0 7.1 7.2 http://web.archive.org/web/20060516005813/forum.pcvsconsole.com/viewthread.php?tid=14535
- ↑ [http://garaph.info/linecompare.php?weeks=230&sum=1&width=&height=&title=&ymin=&ymax=&html=1&sys[0]=Xbox&date[0]=2001-12-31&sfd[0]=&std[0]=2006-01-02&gr[0]=&tra[0]=fam&sys[1]=&date[1]=&sfd[1]=&std[1]=&gr[1]=&tra[1]=&sys[2]=&date[2]=&sfd[2]=&std[2]=&gr[2]=&tra[2]=&sys[3]=&date[3]=&sfd[3]=&std[3]=&gr[3]=&tra[3]=&sys[4]=&date[4]=&sfd[4]=&std[4]=&gr[4]=&tra[4]=&sys[5]=&date[5]=&sfd[5]=&std[5]=&gr[5]=&tra[5]= Original Xbox total Japan hardware sales Garaph]
- ↑ 9.0 9.1 9.2 9.3 9.4 9.5 9.6 Consolidated Financial Statements (PDF) 22. Nintendo (2008-04-24). Retrieved on 2008-04-24.
- ↑ Russell Carroll (September 6 2005). Good Enough: Why graphics aren't number one. Game Tunnel. Retrieved on 2006-08-07.
- ↑ Blake Snow (2007-05-04). The 10 Worst-Selling Consoles of All Time. GamePro.com. Retrieved on 2007-11-22.
- ↑ North America
- ↑ 13.0 13.1 13.2 Game Sales Charts / SEGA Hardware and Software Sales
- ↑ PlayStation2 Cumulative Production Shipments of Hardware | CORPORATE INFORMATION | Sony Computer Entertainment Inc.. SCEI. Archived from the original on June 9, 2012. Retrieved on July 16, 2011.
- ↑ https://web.archive.org/web/20080910032515/www.nintendo.co.jp/ir/library/historical_data/pdf/consolidated_sales_e0806.pdf
- ↑ 16.0 16.1 Matthew T. Clements & Hiroshi Ohashi (October 2004). Indirect Network Effects and the Product Cycle: Video Games in the U.S., 1994-2002. NET Institute. Retrieved on 2011-09-21.
External links[]
| Prev: Fifth generation of video games | Generations | Next: Seventh generation of video games |
![6th gen npd first 5 months.jpg (24 KB) 6th generation NPD first 5 months [1]](https://static.wikia.nocookie.net/vgsales/images/9/90/6th_gen_npd_first_5_months.jpg/revision/latest/scale-to-width-down/400?cb=20090118032207)


