Motivation
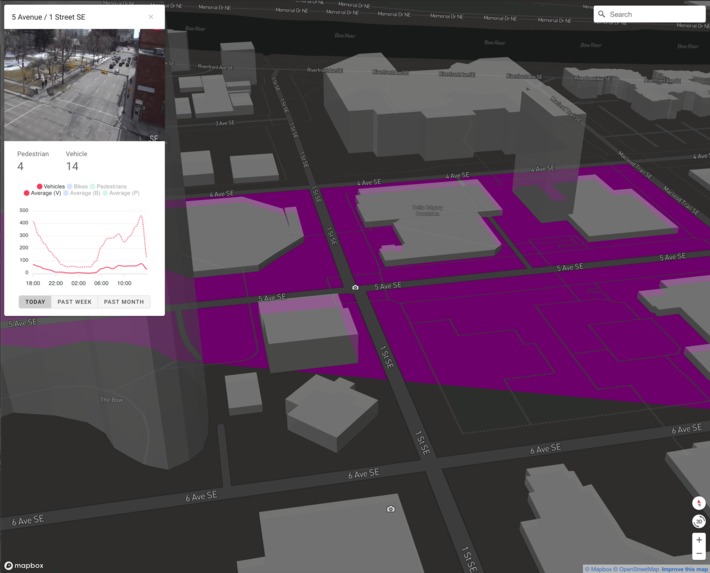
Mobility Explorer is a traffic monitoring platform that collects data from traffic cameras, detects human, car, and bike movements from images, and visualizes the results on a map. It enables users to understand mobility patterns in different geographic areas at a glance, and determine areas at risk from overcrowding, and take an informed action. Such information helps both public officials and emergency responders (e.g., humanitarian organizations, city officials, or local actors) control and enforce social distancing measures in a pandemic and see where measures are or are not working.
Challenges
The spread of COVID-19 is generating a huge disruption in our everyday activities; something many of us have never experienced before in our lifetime with some calling it “a war on an invisible enemy”. It has forced us to follow social distancing policies, temporarily suspend many business activities, and limit our travel. In such circumstances, the use of mobility data is more important than ever. Such data can illustrate the rate and spread of COVID-19 based on how well people practice social distancing, how frequently people venture outside, and how effective people follow official guidelines.
Much of the mobility data being used today comes from telecommunication companies and social media giants. However, there are some challenges when using social media and geolocation mobile phone data. The first issue is about privacy concerns; how such data is used now? Is it aggregated and anonymized “properly”? How could it be used in the future, particularly if it is not used for public health reasons? The second issue is about areas where people have less access to mobile phones or social media; how can we make sure they adhere to social distancing orders? How can we make sure they are safe?
Mobility Explorer is an effort to address these problems — it aims to convert traffic camera images into a reliable source of information and, therefore, enable an effective use of public infrastructure in response to the spread of COVID-19. It uses three machine learning models available on AWS Marketplace to fetch images from traffic cameras, identify the number cars, bikes, and people in different communities, and map the results. The following section presents the technical architecture and describes how the system works.
Solution
Mobility Explorer is built using open source software, open standards, and open data: Node.js and Express, PostgreSQL/PostGIS, Vue.js, Vuetify, and Mapbox GL JS are used to create the system components. It collects images from the City of Calgary’s open data API, analyzes them using three deep learning models available on AWS Marketplace (Human Detector, Scooter and Bicycle Detector, and Vehicle Detector), and displays mobility patterns on a map. The application is hosted on Amazon’s AWS infrastructure.
The workflow starts with the data collection process. A set of Lambda functions use the City of Calgary’s open data API to collect images from traffic cameras every five minutes, triggered by CloudWatch events. For the purpose of this hackathon, they only use the camera IDs for the traffic cameras deployed in the Downtown Core area, however, the support for all traffic cameras can easily be added.
The Lambda functions then send the images to the three deep learning models for processing. The models analyze the images to identify cars, bikes, and people and count their number of appearances in each image. The results are then stored in an Aurora PostgreSQL database.
The frontend application and backend API are developed using AWS Amplify as a single page application backed by a REST API (API Gateway + a set of Lambda functions). The frontend application visualizes traffic trends and provides an intuitive way to compare mobility patterns in different geographic areas at different timestamps.
More info: https://docs.google.com/document/d/1tOn5ZOphGYlZve1OK_fxk7yfvc22x6P6nIBRAko_eBE/edit?usp=sharing


Log in or sign up for Devpost to join the conversation.