This recipe shows how to use VS Code to debug an application generated by the Angular CLI.
-
Make sure to have Google Chrome or Microsoft Edge installed in its default location.
-
Use NPM to install Angular CLI version 6.0 or greater globally.
Please note: Debugging may not function with other versions of Angular CLI.
npm install -g @angular/cli@">=6.0" -
Use Angular CLI to create a new Angular application.
ng new my-dream-app -
Change to the newly created application directory and open VS Code.
cd my-dream-app
code .
-
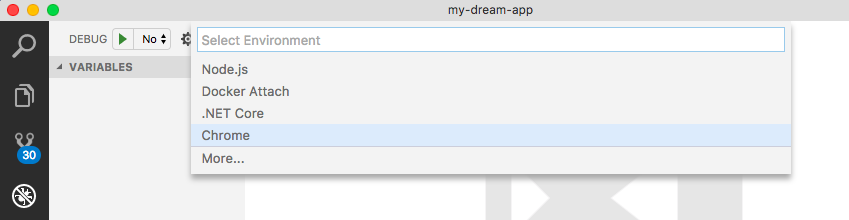
Click on the Debug icon in the Activity Bar of VS Code to bring up the Debug view. Then click on the gear icon to configure a launch.json file, selecting Chrome for the environment:
-
Replace content of the generated launch.json with the following three configurations (use
msedgefor MS Edge):{ "version": "0.2.0", "configurations": [ { "name": "ng serve", "type": "chrome", "request": "launch", "preLaunchTask": "npm: start", "url": "http://localhost:4200", "webRoot": "${workspaceFolder}" }, { "name": "ng test", "type": "chrome", "request": "launch", "url": "http://localhost:9876/debug.html", "webRoot": "${workspaceFolder}", "sourceMapPathOverrides": { "./src/*": "${workspaceFolder}/src/*" } }, { "name": "ng e2e", "type": "node", "request": "launch", "program": "${workspaceFolder}/node_modules/protractor/bin/protractor", "args": ["${workspaceFolder}/e2e/protractor.conf.js"] } ] }-
Since
ng servealso compiles the Angular application it can be used as a build task if you prefer the "PROBLEMS" tab toCtrl + clickin the terminal (for smaller screens you could open the terminal only when the status bar shows there are problems). -
The following
npm: starttask runs in the background, so we never expect it to fully complete. Instead we define a problem matcher, which alerts us that the task is ready.
Please note: Running
npm startinstead ofng serveensures the app is served with the version of @angular/cli specified in package.json.Add the following
npmtask to yourtasks.jsonfile:{ "version": "2.0.0", "tasks": [ { "type": "npm", "script": "start", "isBackground": true, "presentation": { "focus": true, "panel": "dedicated" }, "group": { "kind": "build", "isDefault": true }, "problemMatcher": { "owner": "typescript", "source": "ts", "applyTo": "closedDocuments", "fileLocation": [ "relative", "${cwd}" ], "pattern": "$tsc", "background": { "activeOnStart": true, "beginsPattern": { "regexp": "(.*?)" }, "endsPattern": { "regexp": "Compiled |Failed to compile." } } } }, ] } -
-
Set a breakpoint in app.component.ts on the line that sets the
titleproperty ofAppComponent. -
Go to the Debug view, select the 'ng serve' configuration, then press F5 or click the green play button to start 'Angular Live Development Server'.
-
A console window should appear where
ng servewill run. Once the app is served, or if the task encounters an error, a browser window will appear. Use it to trigger your breakpoint!

-
Set a breakpoint in app.component.spec.ts on a line in one of the unit tests.
-
Open a terminal at the root folder and run the tests using Angular CLI:
Please note: Running
npm run testinstead ofng testensures tests are run with the version of @angular/cli specified in package.json.npm run test -
After the test run, go to the Debug view, select the 'ng test' configuration, then press F5 or click the green button.
-
When a browser opens with the test list, click the link for the test in which you placed the breakpoint. You should then hit the breakpoint:

You can also debug your end-to-end tests running in Protractor with VS Code.
-
Start 'Angular Live Development Server' by starting a debug session in VS Code with our 'ng serve' configuration we created above. Alternatively, and as mentioned above, executing
ng servecommand in terminal will also run the development server but without having VS Code running a debug session for it. -
Set a breakpoint in app.e2e-spec.ts on a line in one of the end-to-end tests.
-
Now go to the Debug view in VS Code, select the 'ng e2e' configuration, then press F5 or click the green button to run Protractor in a debug session.